rbtl - Data Science Lifecycle
Lars Schöbitz
Global Health Engineering - ETH Zurich
2022-04-29
Welcome back!
You got your data!
What’s happening next?
Today
- Classroom tools
- Data Science Lifecycle
- R basics: Functions, Arguments, Objects, Operators
- Live Coding Exercise
- Pair Programming Exercise
- Homework and Project Report
Learning Objectives
- Learners can import their data from a CSV file to a team repository on GitHub
- Learners can list the six elements of the data science lifecycle
- Learners know three different ways of getting support in solving coding problems online
Classroom tools
Live Coding Exercises
- Instructor writes and narrates code out loud
- Intstructor explains elements and principles that are relevant
- Code is displayed on projector screen
- Learners join by writing and executing the same code
- Learners “code-along” with the instructor
Pair Programming Exercises
- Two learners work together on one computer
- One person (the driver) does the typing
- The other person (the navigator) offers comments and suggestions
- Roles get switched
Taking Notes Together
- Questions in shared online document: https://docs.google.com/document/d/1B_fGhU2-p7GdMjDdRq73JXAhAM7VU2JDu6t1foSQ0og/edit
Sticky Notes
- Use as status flags
- Orange: Exercise completed
- Pink: Problem, need support
Data Science Lifecycle
Deep End
1
2
3
4
5
6
7
R
Packages
Functions & Arguments
- Function:
filter() - Argument:
.data = - Arguments following:
year == 2007What do do with the data
Objects
- Function:
filter() - Argument:
.data = - Arguments following:
year == 2007What do do with the data - Object:
gapminder_yr_2007
Operators
- Function:
filter() - Argument:
.data = - Arguments following:
year == 2007What do do with the data - Object:
gapminder_yr_2007 - Assignment operator:
<- - Pipe operator:
%<%
Rules
Rules of dplyr functions:
- First argument is always a data frame
- Subsequent arguments say what to do with that data frame
- Always return a data frame
- Don’t modify in place
Live Coding Exercise
ae-10-data-science-lifecycle
- Head over to the GitHub Organisation for the course.
- Find the repo for week 10 that has your GitHub username.
- Clone the repo with your username to the RStudio Cloud.
- Open the file:
ae-10a-lifecycle.qmd - Use your Sticky Notes to let me know when you are ready.
Break

15:00
Solving coding problems
Tipps for search engines
- Use describe verbs that describe what you want to do
- Be specific
- Add R to the search query
- Add the name of the R package name to the search query
- Scroll through the top 5 results (don’t just pick the first)
Example: “How to remove a legend from a plot in R ggplot2”
Stack Overflow
What is it?
- The biggest support network for (coding) problems
- Can be initimidating at first
- Upvote system
Workflow
- First, briefly read the question that was posted
- Then, read the answer marked as “correct”
- Then, read one or two more answers with high votes
- Then, check out the “Linked” posts
- Always give credit for the solution
Give credit
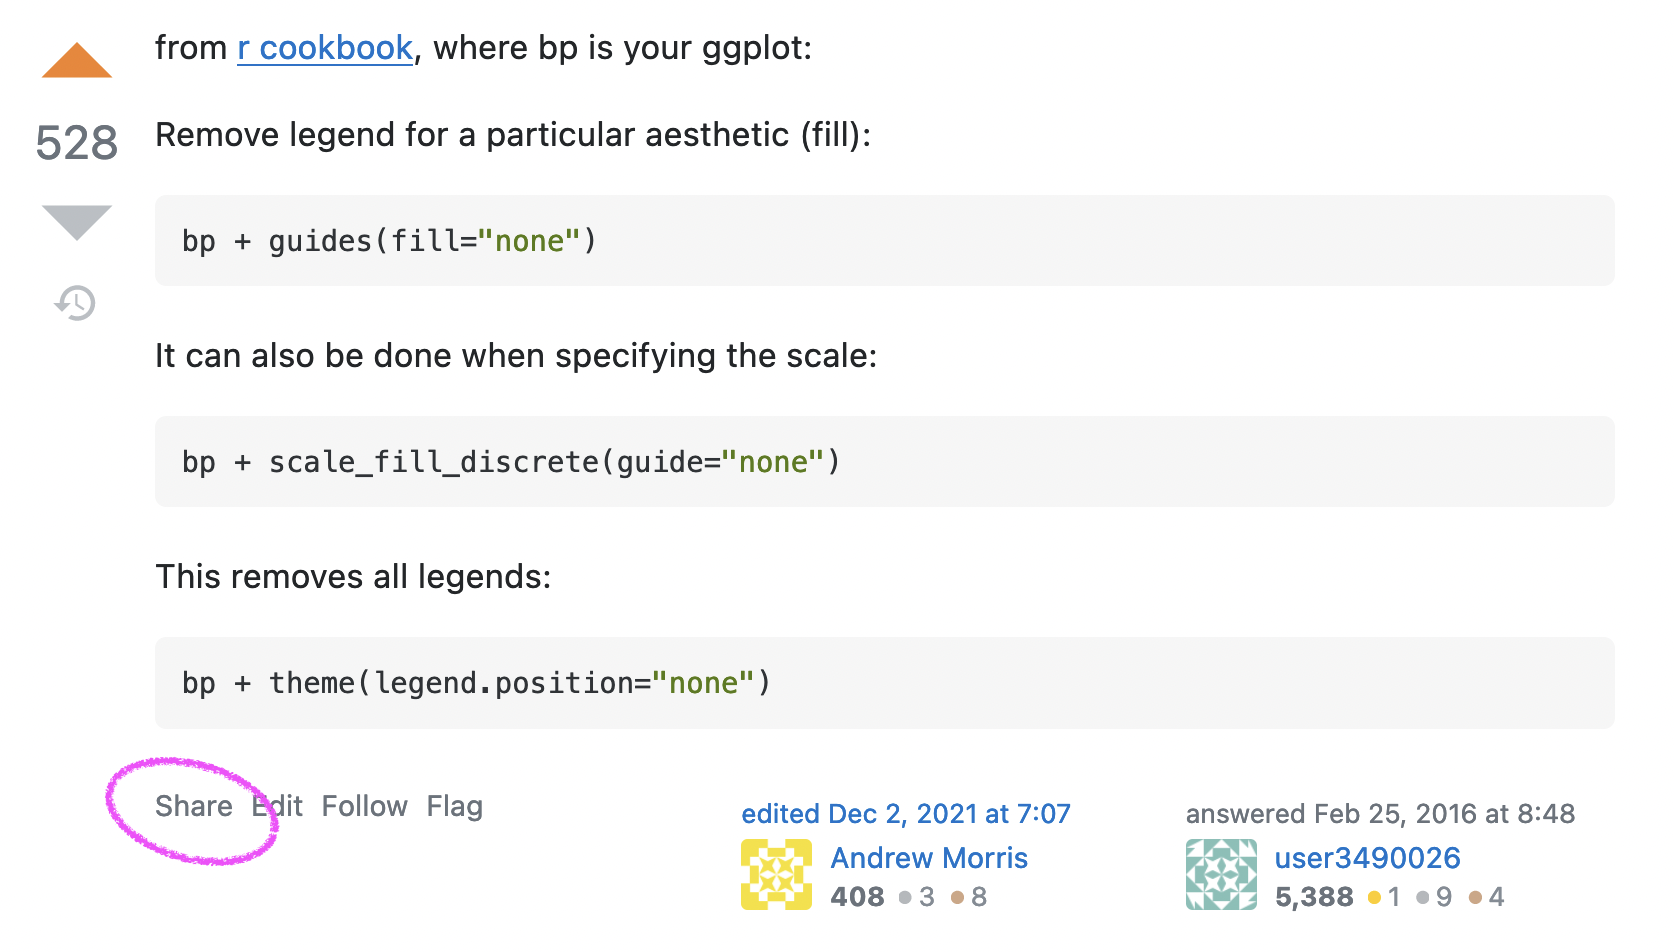
Give credit
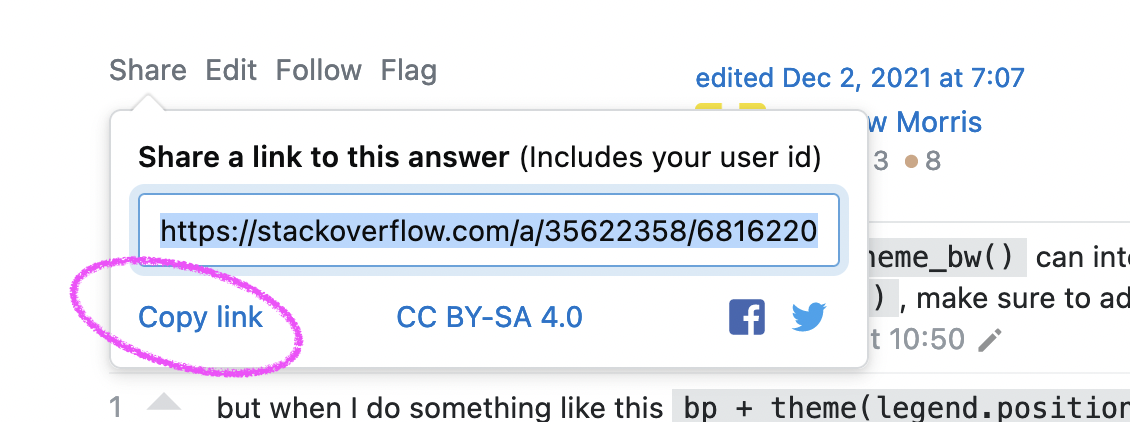
Give credit
Other sources for help
- RStudio Community Forum: https://community.rstudio.com/
- Our rbtl Slack channel
- Documentation websites: https://dplyr.tidyverse.org/
- Twitter community: #rstats

Minimal reproducible example (reprex)
- Needed when asking questions online
- We will practice this in another class
- Good support information: https://www.tidyverse.org/help/#reprex
Break

10:00
Pair Programming
ae-10-data-science-lifecycle
- Team up in pairs
- Decide who writes code, and who supports without writing code
- Open the file:
ae-10b-lifecycle.qmd - Work through the exercises
- Use your sticky notes to indicate if you need support
30:00
Homework Assignment
Teams on GitHub
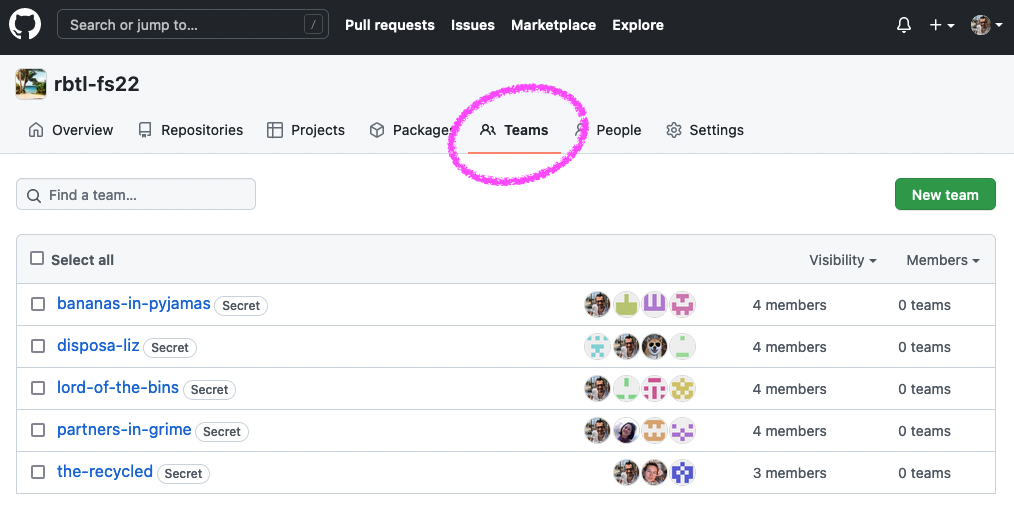
Teams on GitHub
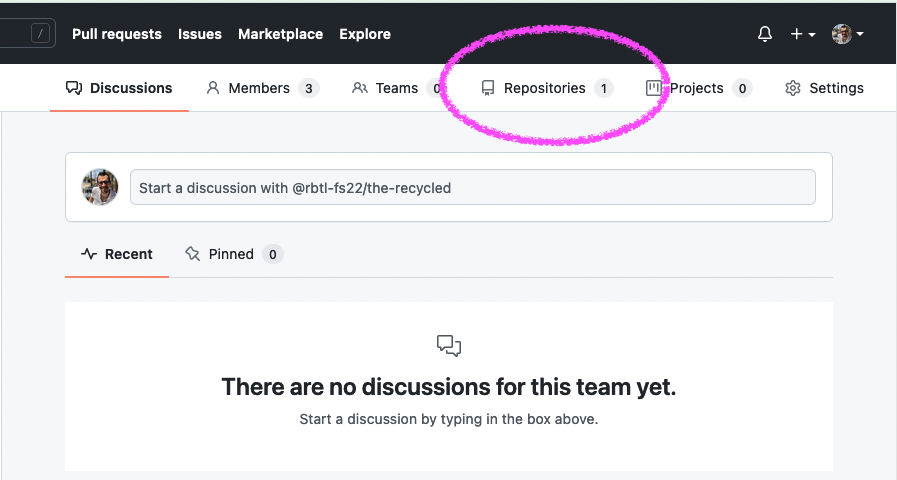
Teams on GitHub
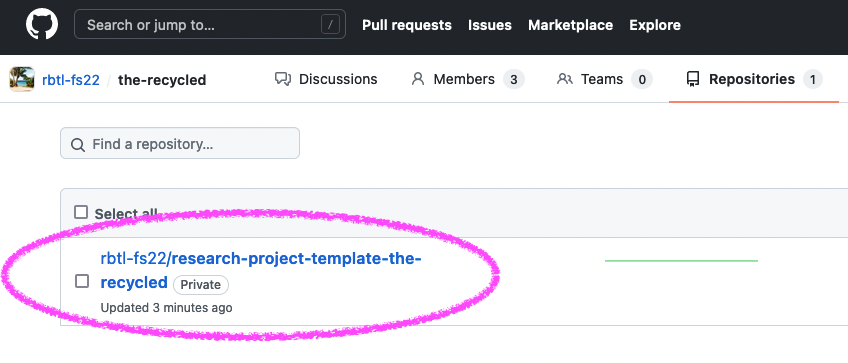
Research Project Template
- Report template
- Complete list of items for grading (also as open Google Sheet)
- Information on intentions for publishing
Discuss and decide
- Data: Who will upload which data as part of the homework?
- Results & Discussion:
- Who writes in file:
03-01-results.qmd?03-02-results.qmd?03-03-results.qmd?
- Who writes in file:
03:00
Submission
- All details in assignment week 10
- Due: Tuesday, 4th May at 23:59 (2 points)
Thanks! 🌻
Slides created via revealjs and Quarto: https://quarto.org/docs/presentations/revealjs/ Access slides as PDF on GitHub
All material is licensed under Creative Commons Attribution Share Alike 4.0 International.